Bismillah...
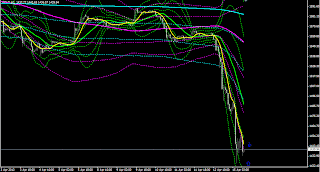
Gold Technical Analysis. today's price action, note the position on gold price chart today, the monthly TF condition strong down trend, or the seller power is dominant in monthly, weekly MA is below sd-1 monthly BB, stronger opportunities down in monthly.
conditions on weekly TF strong down trend because daily MA is below sd-1 daily BB, stronger opportunities decline in weekly.
furthermore, what steps should be done by day trading? consider the condition of the second time frame, a strong trend down. The first resistance at the highest price, and support at the lowest price today. observe the behavior of the price at the check point. if price bounces of support and resistance, doing counter open position. the daily average gold has moved down, by 327%, so it is likely to fall further rather small. follow the trend!
| TRADING SIGNAL TODAY | ||||||
| BUY | : | 1428 | ||||
| SL | : | 1422 | ||||
| TP | : | 1440 | ||||
Have a nice trade


0 komentar:
Post a Comment